


 22 / 56

20 |
Oilfield Technology
May/June 2020
In real time this data is used for:
Ì
Quantitative formation evaluation and correlation.
Ì
Geosteering (or elemental steering).
Ì
Avoiding drilling inefficiency and non-productive time (NPT).
Ì
Optimising landing targets.
Therefore, capital efficiency is driven by the ability to provide
high-tech low cost, high-value low risk information that would
otherwise not be available.
HML provides real time QA-QC of the samples and data. Problems
with lag depth and sample representation and contamination can
be resolved immediately rather than weeks or months later. Similar
laboratory-based services may provide data much later and at
higher cost. Real time analysis also reduces the risk of mislabelling, as
well as incorrect transport and storage of samples.
Qualityandtruth indata
Data quality starts at the rig site with trained field personnel
supported by experienced laboratory staff providing set-up, ongoing
quality assurance, and training. Instrument performance is regularly
monitored using certified geological reference materials from the
US Geological Survey (USGS) and National Institute of Standards and
Testing (NIST). Additional daily QA-QC and interpretation is performed
by experts in XRF, laser-induced breakdown spectroscopy (LIBS) and
chemostratigraphy.
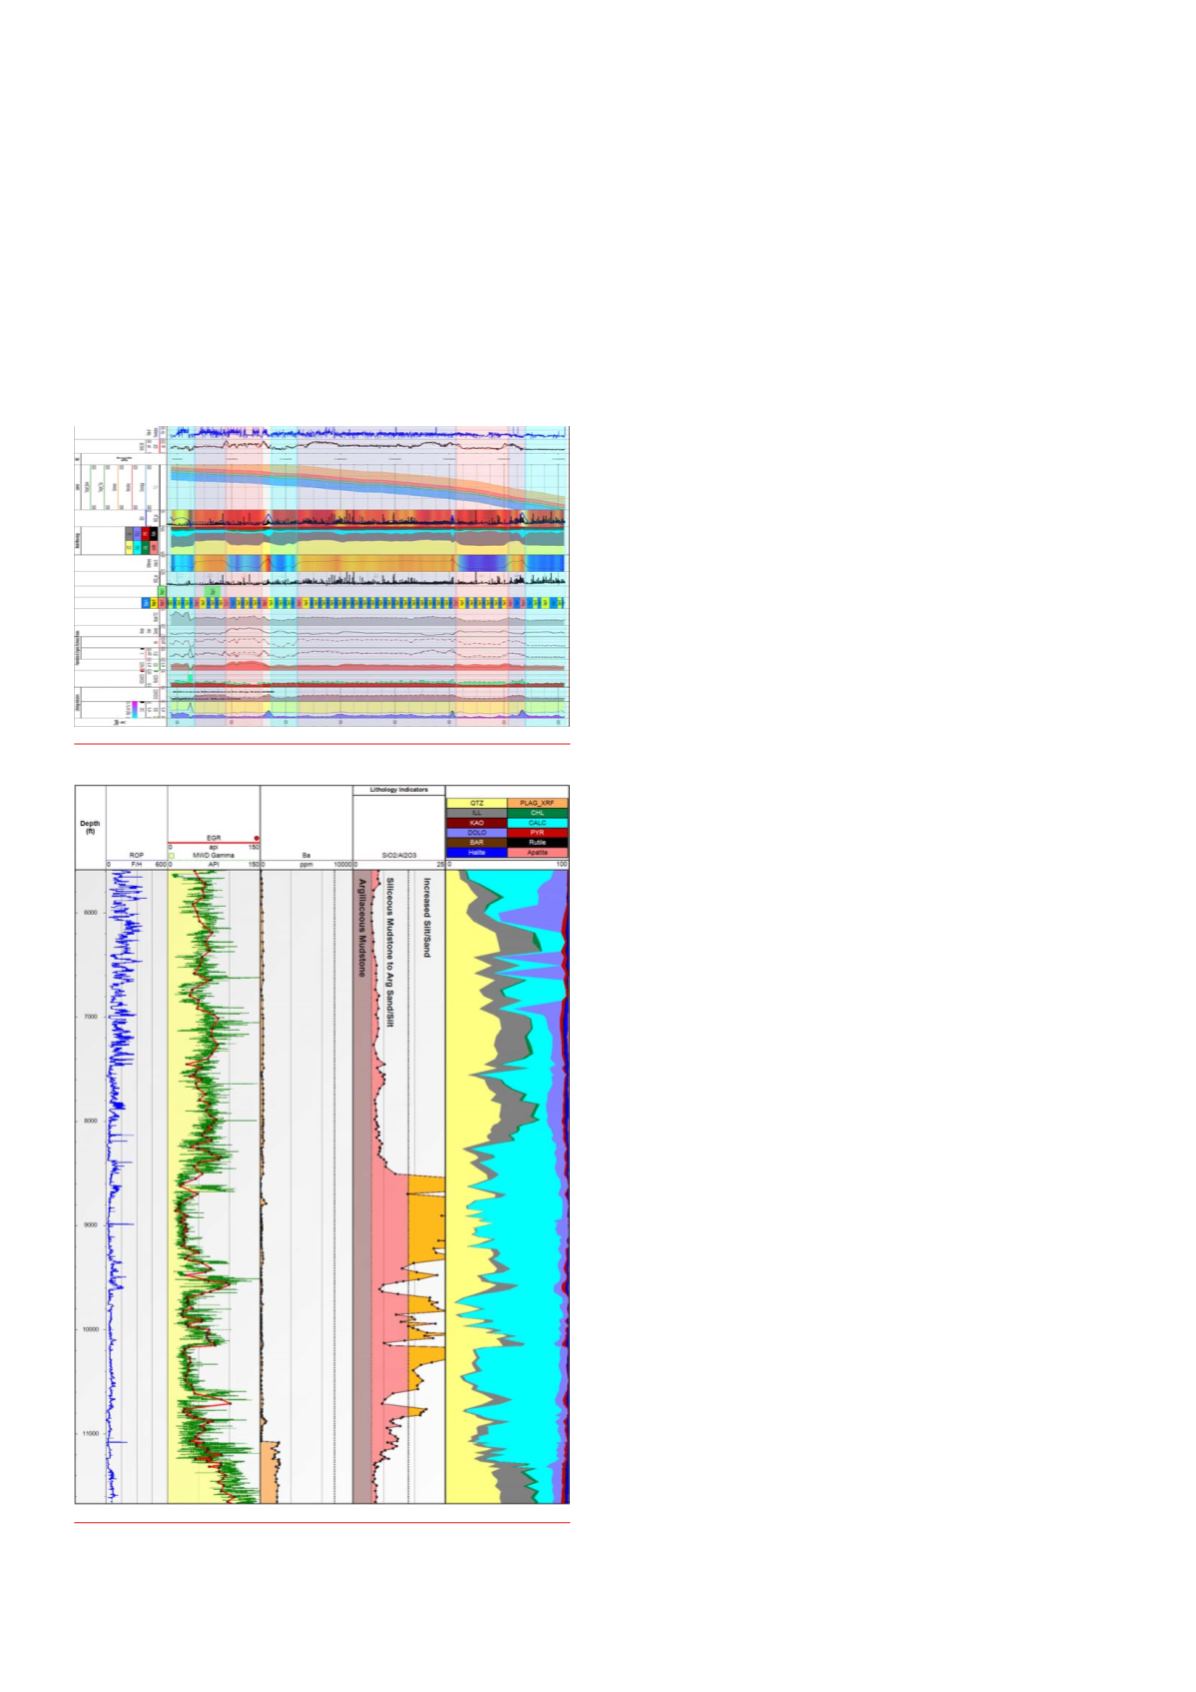
Depth control is a very important part of the quality process.
Knowing that the samples are from the correct depth is a common
concern for geologists and drilling engineers. Continuous comparison
of EGR to downhole gamma ray (GR) provides confirmation the
samples are on-depth. When coherence is poor, the cause is
investigated and remediated in real time. This ensures additional
analysis such as X-ray diffraction (XRD) and pyrolysis are performed on
samples which are on-depth, represent the interval drilled and have a
known degree of contamination (Figure 2).
Furthermore, in a recent case study, as the EGR was available in
real time, it allowed a West Texas operator to utilise the information
to keep drilling when the downhole GR tool failed, resulting in
considerable savings in NPT by avoiding an unnecessary trip.
Datadrivendrillingandcompletionefficiency
Elemental and drilling field data is streamed into a real time operations
centre in Canonsburg, Pennsylvania, US, where geoscientists and
geosteerers integrate downhole and surface measurements to ensure
the wells are steered precisely and accurately within target windows.
Geosteering by GR alone may have a higher degree of uncertainty.
The integration of elemental markers greatly reduces uncertainty
and highlights important chemostratigraphic changes that GR alone
cannot.
Using HML data and smarter software, a South Texas operator
was able to successfully GeoStop a well which faulted 200 ft out
of the Austin Chalk into the overlying Anacacho Formation. The
magnitude of the fault and formation dip after the fault determined it
was not possible to steer the wellbore back into the target before the
planned total depth of the well. With average drilling and completion
costs in this area estimated to be in the US$8 – US$10 million range,
considerable savings were realised (Figure 3).
Quantitative elemental data combined with AI prompted
another South Texas operator to radically re-evaluate its mud logging
programme. One well per pad was standard practice using traditional
mud logging. Following a trial of HML, the operator found it was able
to predict hydraulic fracturing efficiency without the cost and time
of running micro-seismic and fibre-optic measurements. The power
and utility of quantitative geological data combined with innovative
software led the operator to deploy HML on all wells in South Texas for
2020 (Figure 4).
Quantitativesurfacederivedgeological data
enhancesAI
A vast amount of information can be garnered from rocks and gas
collected at the surface while drilling. XRF elemental data is used to
model mineralogy, TOC, matrix density, and estimate parameters such
as bulk density and porosity. This can be achieved without the cost and
risk inherent with downhole tools, resulting in potential savings in the
range of US$500 000 – US$5 million. The global cost of losing tools and
hole stability NPT runs into billions of dollars annually.
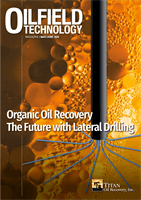
Figure 1.
Near real time data feeds engineered completions designs.
Figure 2.
GR vs EGR shows good on-depth samplingandBa
concentration shows acceptable contamination levels.