


 28 / 56

26 |
Oilfield Technology
May/June 2020
The problem lies in the overly generalised promises of data
tools. The data tools delivering real value today originate from
small, specific tasks, and expand their scope as these niche
applications deliver results. The transformation is not only
centred around data, but also a cultural shift and understanding
thatmany time-consuming tasks can be simplified through a
newapproach.
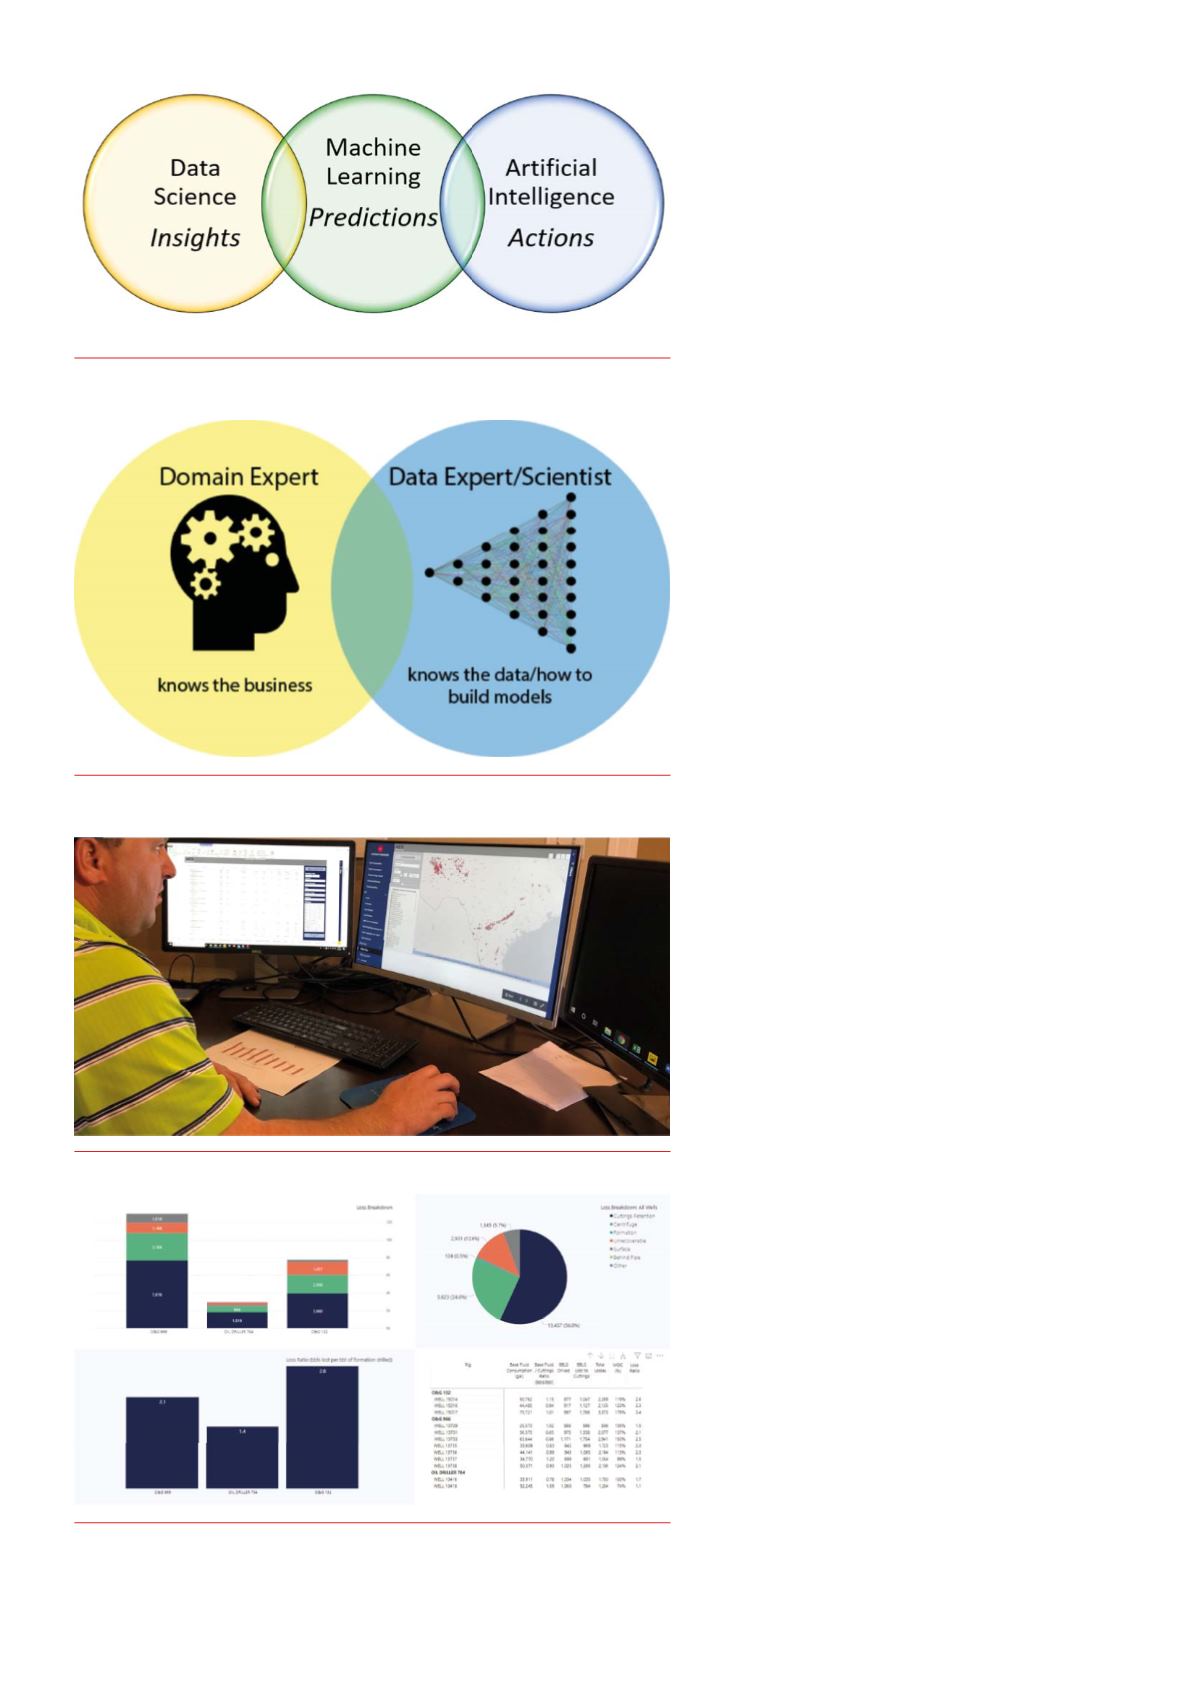
Introducing data tools that start with an initial area of focus
not only avoids ‘mission creep’, it also unites a small group of
data scientists and domain experts through the establishing of
an achievable task (Figure 2). Domain experts are essential to
defining the need and evaluating the utility of the deliverables
provided by data scientists. In ideal cases, the domain expert
also acts as the data scientist tomake the toolset as useful as
possible for their day-to-day role.
Byway of example, using the analogy of self-driving
automobile technology, an experienced data scientist who has
a limited understanding of fundamental automobile designs
and conceptswill fall short of developing an impactful analytics
platformwithout the input of their domain expert counterpart.
Analyticsplatformdevelopment
For the development of AES ANALYTICS, a drilling fluid data
analytics platformdesigned by AESDrilling Fluids, account
managers and field specialistsworked directlywith data
scientists, including thosewith field experience, to develop the
initial toolkit. A key differentiator fromgeneral data analytics
tools is that whilemany of these can report on the best drilling
fluid properties, an expert-driven platformoffers insight into the
lowest-costmeans to achieve andmaintain these best-practice
properties.
The foundational data tools of the platformwere built from
fluid reports, in particular comprehensive drilling fluid recaps
generated at the end of thewell. These data sets are regularly
reviewed as offset information to improve upon performance
drilling futurewells. Furthermore, customers regularly ask for
data sets to evaluate their own performance. Key performance
indicators (KPIs), such as cost, performance, and drilling fluid
properties, are reviewed on a quarterly basis.
Historically, this datawas gatheredmanually or through
database queries in advance of planning or reviewmeetings.
This time-consuming, repetitive task took personnel away from
monitoring activity and identifying best-in-class performance
criteria for the customer. Data analyticswas a clear opportunity
to answer the same questions through the click of amouse.
The platform’s first dashboards focused on answering the
most common questions for well planning and KPI meetings
(Figure 3). Topics includedmudweights, drilling fluid losses,
product consumption, cost vs days, and comparisons between
drilling rigs (Figure 4).
Clear visualisations and the ability to investigate interesting
data points by sliding or clicking on a graph provides access to
information quickly, but it also reveals erroneous or incomplete
data. Over the years, errors can accumulate and require a
thorough quality control review. A substantial amount of the
initial work centred around verifying data sets.
With a validated data structure, the platformwas
slowly deployed to customers and accountmanagers. An
email account was set up to address any errors and for new
feature requests. The customer dashboards, centring around
KPI metrics, weremade available through an individual,
unique login. The ability to expand the technology from its core
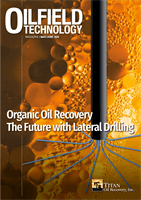
Figure 1.
Comparisonbetweendata science, machine learning, and AI.
Figure 2.
Collaborative overlapneeded for domain experts anddata
experts/data scientists.
Figure 3.
Accountmanager utilising AES Analytics for an upcomingKPI meeting.
Figure 4.
Dashboard visualisation comparingdrilling fluid losses across 12wells drilled
by 3 rigs.