


 19 / 56

May/June 2020
Oilfield Technology
|
17
the salt. These issues are difficult to resolve using existing streamer data
and conventional imaging technology (Figure 1).
However, the use of an appropriate data-drivenmodel building
algorithm, such as TL-FWI, with the right OBNdata can unlock the details
of the salt complexity. As seen fromthemodel comparison in Figures 2a
and 2b, the technologywas able to correct the initial saltmisinterpretation
and add precious velocity details that would be impossible to achieve
using conventional tomographic ormanual interpretationmethods.
The significant contrast between shallow, slowsediment and the deep
super-fast Cretaceous is accuratelymodelled and the salt can nowbe
easily interpreted. The image on the right-hand side of Figure 2b, produced
using this detailed velocitymodel, has capitalised on the benefits of
TL-FWI. In terms of the value to interpretation, there is significant uplift
for a number of important features. There is no longer distortion of the
Oligocene layer (6 to 7 km) and the truncations in the steeply-dipping
Cretaceous layers against the salt are greatly improved (below8 km).
Data-driven imaging for complexgeology
Structural imaging of theHerschel field is not the end of the story. The
RTM images still suffer from irregular illumination andmigration artifacts
originating fromboth the salt canopy and the small areal extent of the
survey, causing edge effects. An imaging process using a newLSRTM
approach
3
was implemented to better handle these challenges. This
approach estimates the inverse of the forwardmodelling operator
(i.e. the imprint of themigration process on the imperfect dataset),
then applies this for different structural dips, frequencies and offsets to
compensate for frequency-, angle- and offset-dependent illumination
effects. Compared to the RTM, LSRTM further improves the image
withmore balanced amplitudes, improved resolution, and an
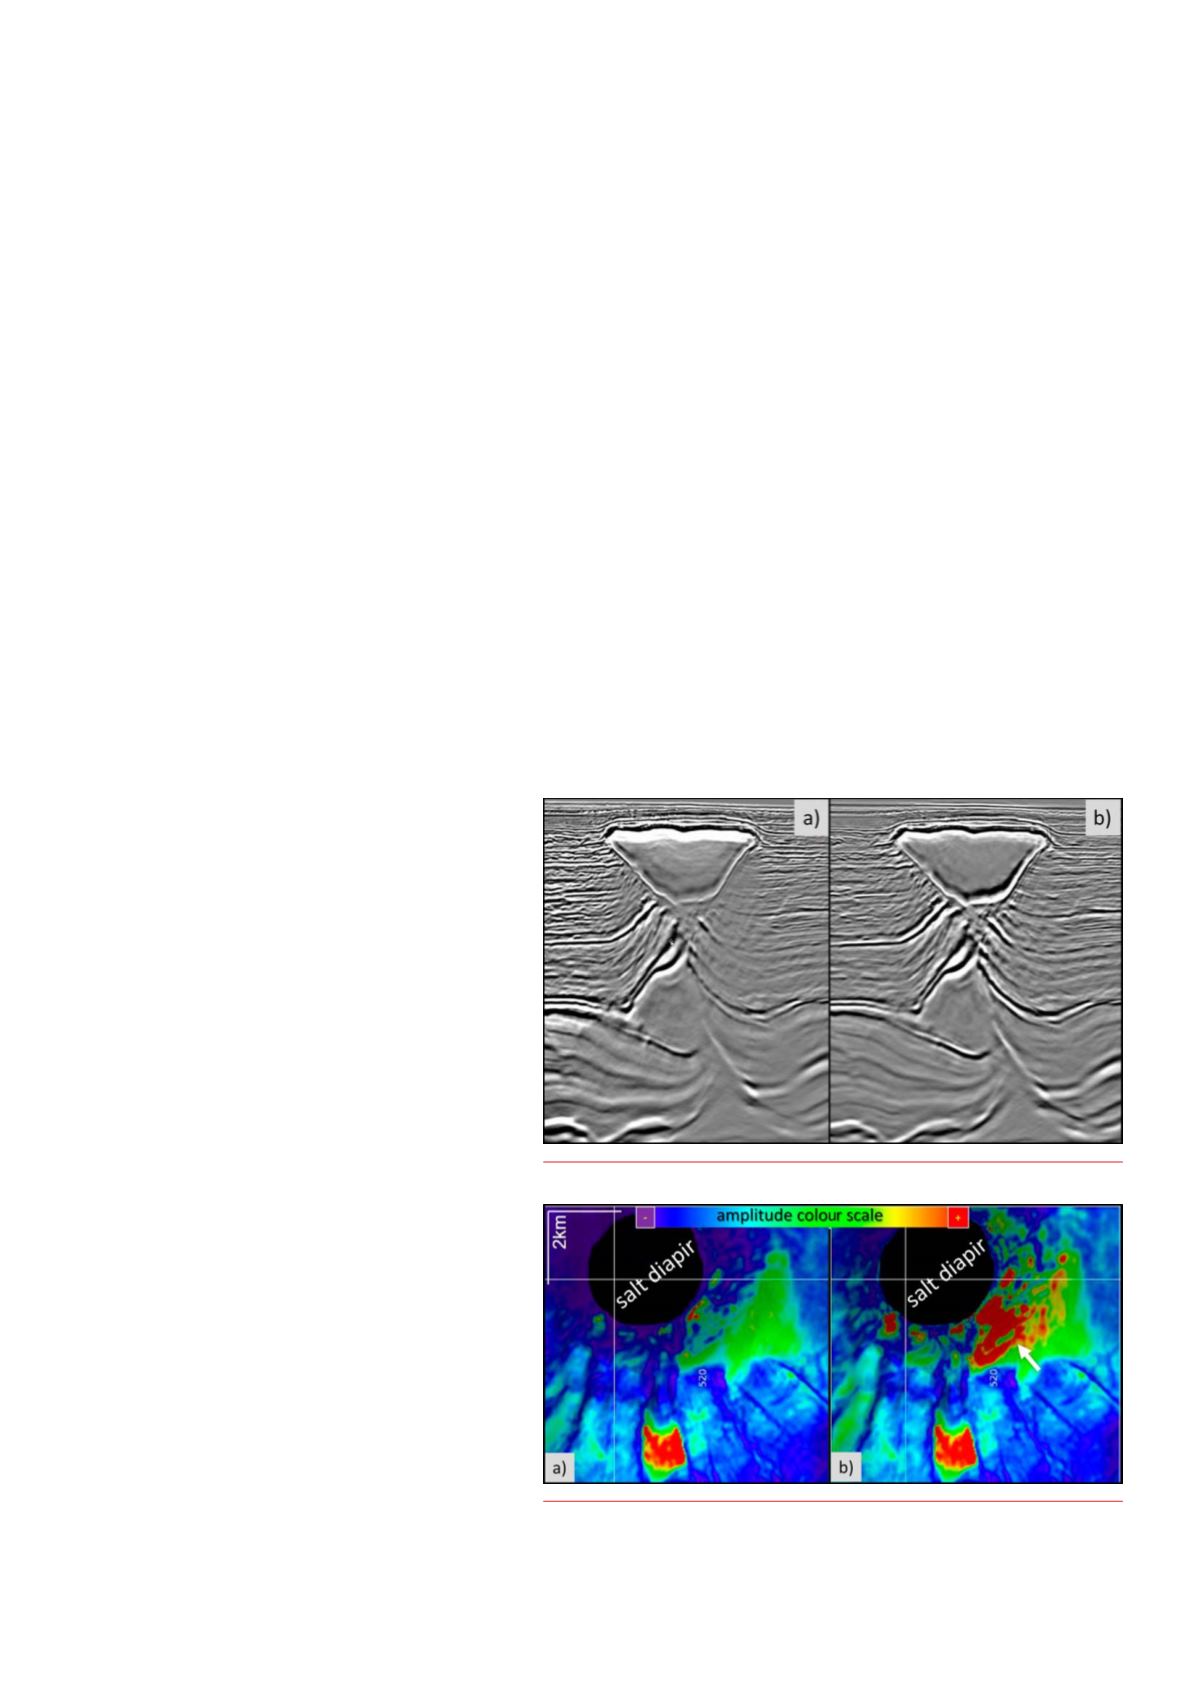
enhanced signal-to-noise ratio (Figure 3). Figure 4, representing
the extracted amplitude along an interpreted horizon at a depth
of approximately 5 km, shows the extent towhich the loss of
illumination around the salt body observed in the RTM image (4a)
is compensated for in the LSRTM (4b).
Large-scaleOBNsurveys inCentralNorthSea
The latest generation of broadband towed-streamer surveys
have revealed additional insight into the remaining potential
of the Central North Sea (CNS). CGGhas regularly drawn on
its experience in this region to apply its latest acquisition and
processing technologies in order to improve the imaging of its
challenging geology. Currently, a contiguous data volume of
over 35 000 km
2
of recent streamer data is being imaged using
aQ-Tomo, Q-FWI, andQ-RTM. This compensates for absorption
effects (Q) and is designed to providemore reliable images and
attributes for quantitative interpretation (QI). Regional pore
pressure prediction and quick-look AVOattributes have been
derived fromthis data to provide insight for reservoir development
and near-field exploration. The images of the deeper high pressure
high temperature (HPHT) reservoir targets have been enhanced
with 8600 km
2
of dual-azimuth coverage data obtainedwith
orthogonal passes of towed streamers.
Therightdata
Despite the uplift in subsurface images brought about by
dual- andmulti-azimuth streamer surveys and the latest
imaging technology, there are specific scenarioswhere the
technical limitations of what can be achievedwithin the
geometrical constraints of towed-streamer data have likely been
reached. Overcoming the toughest challenges of the CNS, such
as complex salt diapirismor deep reservoir characterisation in
structures beneath the Base Cretaceous Unconformity (BCU),
requires the next step in seismic acquisition. If designed appropriately,
OBNacquisition is now the right technology tomake that next step. The
goal is to target the remaining reservoir opportunities below the BCUas
well as any potential upside hydrocarbon volumes in existing Tertiary
discoveries around salt diapirs (Figure 5).
OBN represents the best way forward to sample the subsurface
with a uniformdistribution of offset-azimuths and a rich bandwidth,
especiallywith noise-free low frequencies. Proven data-drivenmodel
building technologies, such as TL-FWI, will then reap the full benefit of
the recordedwavefield that has densely sampled every corner of the
subsurface. The technologywill properly addressmisinterpretation
of the strong velocity contrasts of Quaternary channels in the very
shallowsubsurface aswell as contourites present in the shallow
Tertiary section, and possibly highlight some inter-bedded sand injectites.
By resolving any existingmisinterpretation of strong velocity contrasts
and velocity details in the overburden, imaging through LSRTMwill then
increase the resolution and recover the amplitude of target horizons
impacted by various artefacts originating fromthe rugose top chalk
andBCU surfaces, or fromsand injectites and shallowpolygonal faults.
In addition, the increased fold gainedwithOBNwill provide amuch
cleaner image.
Reasonablywell sampledOBNdatasets result in better removal
of strong propagation effects. Advanced demultiple and deghosting
algorithms benefit fromreceiver positioning on the seafloor. In addition,
the anisotropy of the subsurface, which often skews and slightly distorts
images, will bemore accurately taken into account due to the full-azimuth
sampling of thewavefield in all directions. The tailored processing of
OBN surveys in the CNSwill generate data that is intrinsically suitable for
Figure 4.
OBNamplitude image alongan interpreted horizon (5 kmdepth) for a)
conventional RTMandb) LSRTM. White arrow indicates the amplitude recovery near
the salt.
Figure 3.
OBN images generatedby a) conventional RTMandb) LSRTM.