20 |
Oilfield Technology
September 2016
the strain field has rotated to a more north-south trend but is also
significantly more vertical. Finally, in interval three, looking at the
events in the far NE, the tensional strain field is almost entirely vertical.
In each of the time slices examined in Figure 1, it is possible to
identify main clusters of events and further examine the stress-strain
relationships using these clusters in a stress inversion (Figure 2). In
the latter two intervals, there is a cluster of events to the NE that
is analysed separately from the main body of events. In addition,
outlying events are excluded, including the modest numbers of
events towards the SE, to ensure statistical power. In interval 1, the
initial stress axes are oriented with A1 close to SHmax for the area, A2
close to vertical, and A3 sub-horizontal in the NW/SE direction. For
interval 2, corresponding to the main growth of events, the cluster
near the perforations shows a flip in A2 and A3 compared to interval 1,
consistent with a lower value for stress ratio, R. The cluster to the NE
has significantly different stresses, however, with A1 orienting near
vertical and A2 and A3 shifting to sub-horizontal. Finally, in interval 3
towards the end of the treatment, A1 has rotated to a EW direction
and A3 is more NS. The NE cluster also shows a stress rotation, with A1
being relatively stable and A2 and A3 rotating counterclockwise 45˚.
The spatial and temporal variability of the strain field over the
three time intervals through the progression of the stage of the
strain field implies that the stress regime is highly dynamic though
the treatment. This information is not something that is typically
captured using microseismic event location analysis and can assist
in characterising the fracture state in the reservoir for geomechanical
purposes.
Hydrocarbonproductionanddrainagepathways:
evaluatingseismicityandflow
To close the gap between microseismic analysis and decline curve
estimation, it is important to understand which zones of a reservoir
will effectively contribute to production, and how quickly this
drainage will occur after treatment. As discussed above, not all
microseismic events will contribute to production. Considering the
complexity in local strain and stress fields reflected in the seismicity,
using a one-dimensional analysis of microseismic event clouds may
over-estimate the size of the stimulated region.
Further extending this method of deformation state analysis using
moment tensor derived stress and strain information, it is possible
to estimate potential preferred flow pathways for hydrocarbon
production. By assuming that flow will occur along cracks that are
preferentially oriented to the minimum principal strain axis, flow
pathways through the strain field can be mapped to identify drainage
patterns of individual ports (centres of the perforations for each
stage) throughout the stimulated reservoir volume. In this way,
streamlines are identified that represent the trajectories of particles
in a steady flow, where the streamlines are tangent to the velocity
vector of the flow and perpendicular to equipotential lines. In other
words, streamlines aid in identifying the origin of the hydrocarbon
flow arriving at each port. By complementing flowmaps with seismic
deformation, it is possible to identify areas of high seismic deformation
and parallel stream lines that will drain hydrocarbons quickly and
easily as well as areas with convoluted streamlines and low seismic
deformation that will drain more slowly (Figure 4).
Casestudy: correlatingreservoirdrainagepathways
andwell production
Using microseismic data from a multi-well hydraulic fracture
programme targeting the Muskwa, Otter Park and Evie formations
in the Horn River, NE British Columbia, this article examines how
turbulence in flow and complexity of flow can compromise the
uniformity of production along treatment wells. The data set
examined in this study consists of over 30 000 moment tensor
inversions for microseismic events generated over 90 stages of a
zipper-frack well stimulation.
As shown in Figure 4, complementing the flow maps with seismic
deformation identifies areas of high seismic deformation that align
with parallel streamlines and areas of low seismic deformation that
appear to align with convoluted streamlines within the different
formations. These observations suggest that drainage in the
reservoir is not uniform and some wells will drain hydrocarbons
more quickly and easily than others. The response within each
formation also provides some insight into the production from each
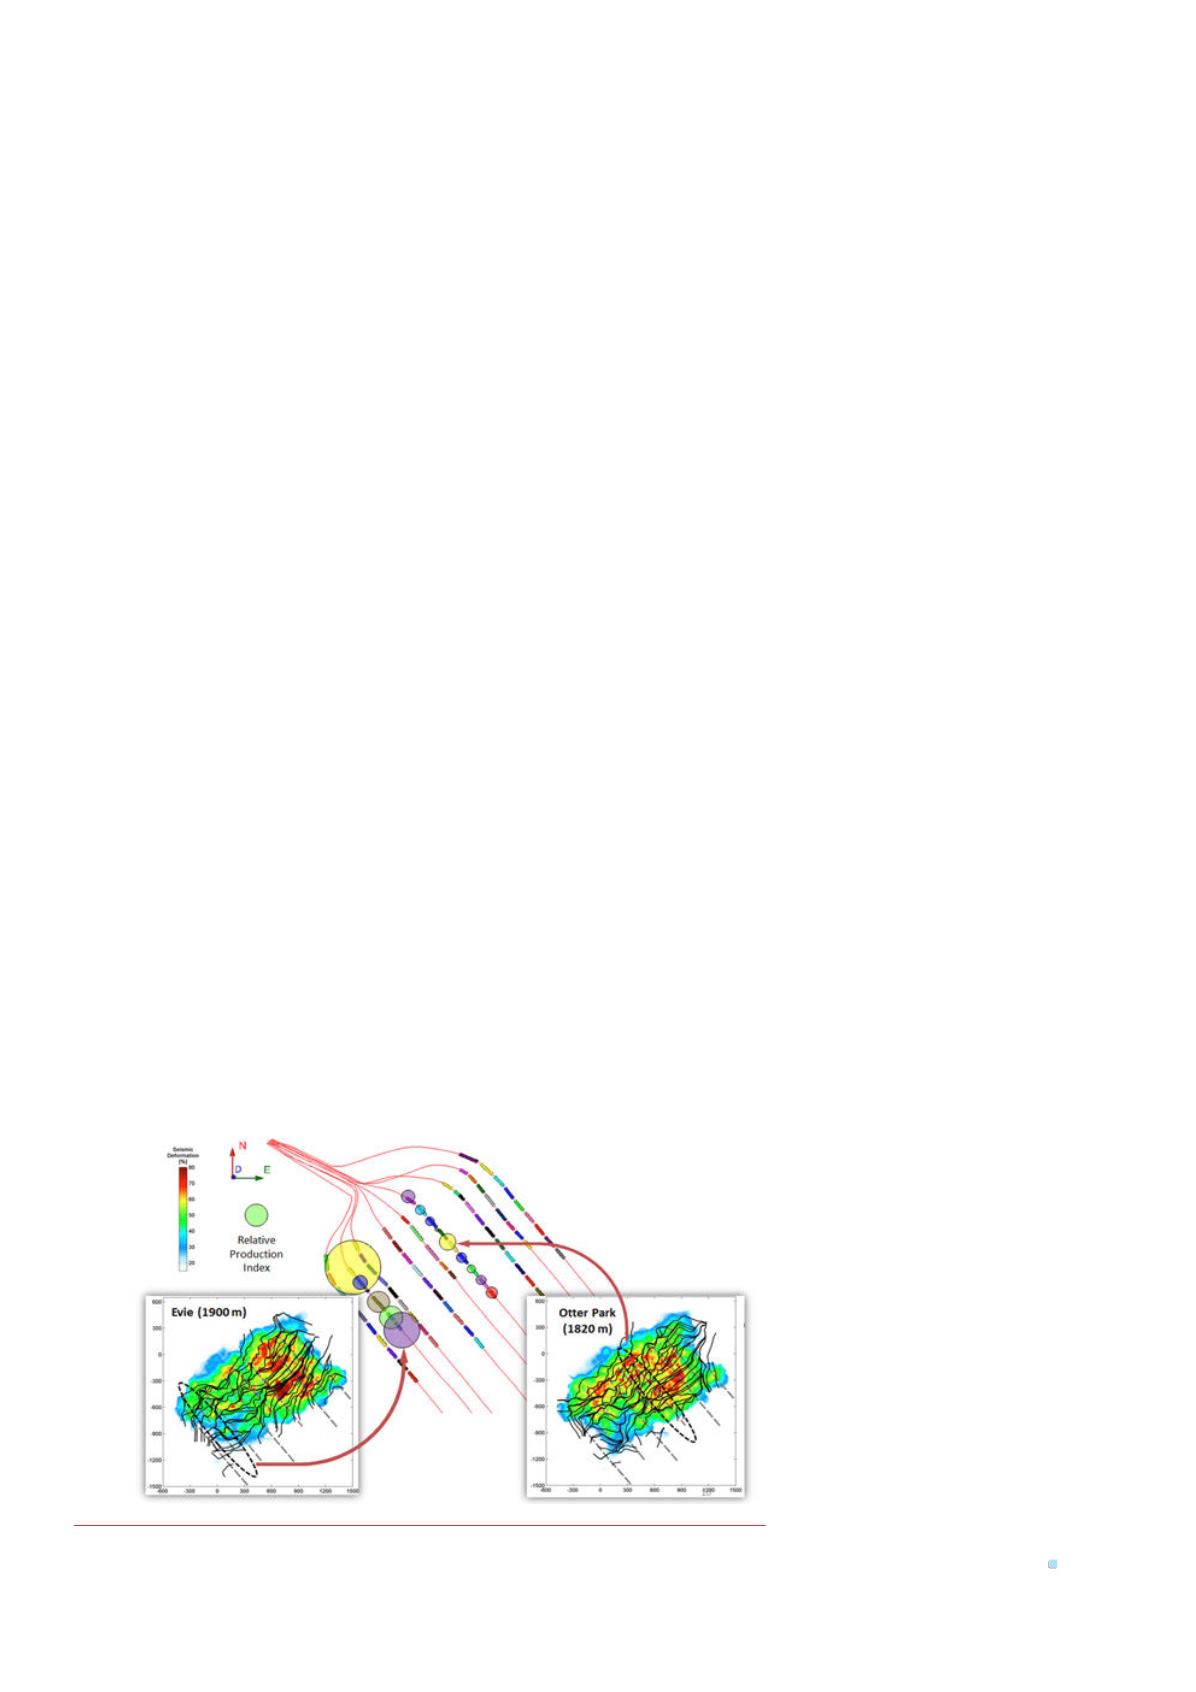
formation. Production logging (PLT) was performed on the wells to
provide information on the relative production from each stage. A
comparison of these results for two wells targeting the Otter Park and
Evie formations is provided in Figure 5. It is clear that high seismic
deformation and uniform parallel flow lines, or drainage pathways,
coincide with a more homogeneous distribution of production,
whereas tortuous flow paths and low seismic deformation coincide
with irregular production, respectively. Of particular note is the
variability of production between the various stages along the well in
the Evie formation.
The current state-of-the-art in microseismic monitoring for
hydraulic fracturing operations represents a fundamental shift in
the way microseismic data is evaluated.
Characterising reservoir deformation as it
relates to dynamic strain and stress fields
present useful new inputs for geomechanical
models. A new methodology is presented
for the characterisation of reservoir
deformation as the flow of stress which
demonstrates an analogous response to
production, suggesting that calculated
flow parameters can be used as a proxy for
identifying production regularity for wells.
Inherently, it also suggests that it is possible
to further use these ‘streamlines’ to optimise
stimulation, including well spacing, well
landing and stage spacing. Streamlines
may also inherently provide information on
rock properties, which when correlated to
measured rock properties can be used to
enhance stimulation programmes.
Figure 5.
Relative Production indices based onPLT data for wellswithin theOtter Park and Evie
formations alongwith streamline and seismic deformation relationships.


