16 |
Oilfield Technology
September 2016
fractures and geologic properties of the media. Orientations of
di erent fracture sets, their intensities, and spacing, along with
characterisation of their size scales, critically impact geomechanical
predictions of the stimulations in terms of proppant and fluid
placement and the decline of reservoir productivity. Well logs, core
analysis, and downhole acoustic measurements such as microseismic
typically provide the necessary inputs for geomechanical modelling.
Microseismic event distributions estimating the fracture
geometry are typically used to constrain geomechanical models.
However, a basic assumption of such efforts is that the stress
regime under which the events are occurring is invariant. By using
multiple-well recordings of microseismic events, the mechanisms
of the microseismicity may be determined. These mechanisms are
proportional to the strain rate (deformation) that is imparted to the
medium at the point of rupture, and as such constrain the strain
as well as the stress regime through the treatment. Observations
indicate that the stress/strain conditions in the reservoir can be
highly variable, implying that microseismicity needs to be coupled
to geomechanical models at a more basic level, since the dynamic
stress regime controls both the occurrence of these events and the
propagation of fluid and proppant in the reservoir.
Microseismicmonitoring
Many operators routinely acquire downhole or surface-based
microseismic surveys and integrate this data into complex
geomechanical models for calibration purposes. During hydraulic
fracture stimulations, changes in stress conditions in the sub-surface
cause small rock movements and the release of detectable seismic
energy. Sensitive instruments deployed in adjacent wellbores or
in dense grids on the surface are able to detect seismic waveforms
and calculate the origin of the seismic energy, known as the event
location. Typical analysis of microseismicity associated with hydraulic
fracturing has focused primarily on event locations and magnitudes to
characterise the growth of the stimulated region during the treatment.
However, considerably more information about the energetics of the
fracturing processes can be uncovered through in-depth analyses of
other microseismic source parameters (besides magnitude).
Hydraulic fracturing is a process that perturbs the reservoir
around the injection ports, creates a network of damage, and injects
proppant into these fractures to promote permeability and drainage
from the reservoir. The fracturing process leaves a seismic expression
that is responding to a combination of either Coulombic stress
transfer on favourably oriented fractures or fluid-induced tensile
mechanisms. Both of these end members impose certain constraints
on the stress regime, and in general imply that the stress regime
during the fracturing process involves significant alteration of the
background stresses.
Describingreservoir strainandstress
The deformation in a rockmass can follow a number of different
trajectories in the stress and strain space. Generally, as deformation
proceeds in a rock mass the amount of stress required for a given
strain (stiffness) can change. Monitoring the evolution of the
deformation could provide useful information about the state and
evolution of the rock mass. For example, the identification of key
factors that will control strain and flow behaviour include local
geology and rock properties, local stress state and pre-existing
fracture network, treatment design (e.g., well spacing, well landing,
azimuth, stage spacing), and treatment schedule (e.g., pressure, flow
rate, fluid and proppant type, timing).
Each microseismic event represents deformation (strain rate)
in the rock from slip along a (generally rough) fracture with finite
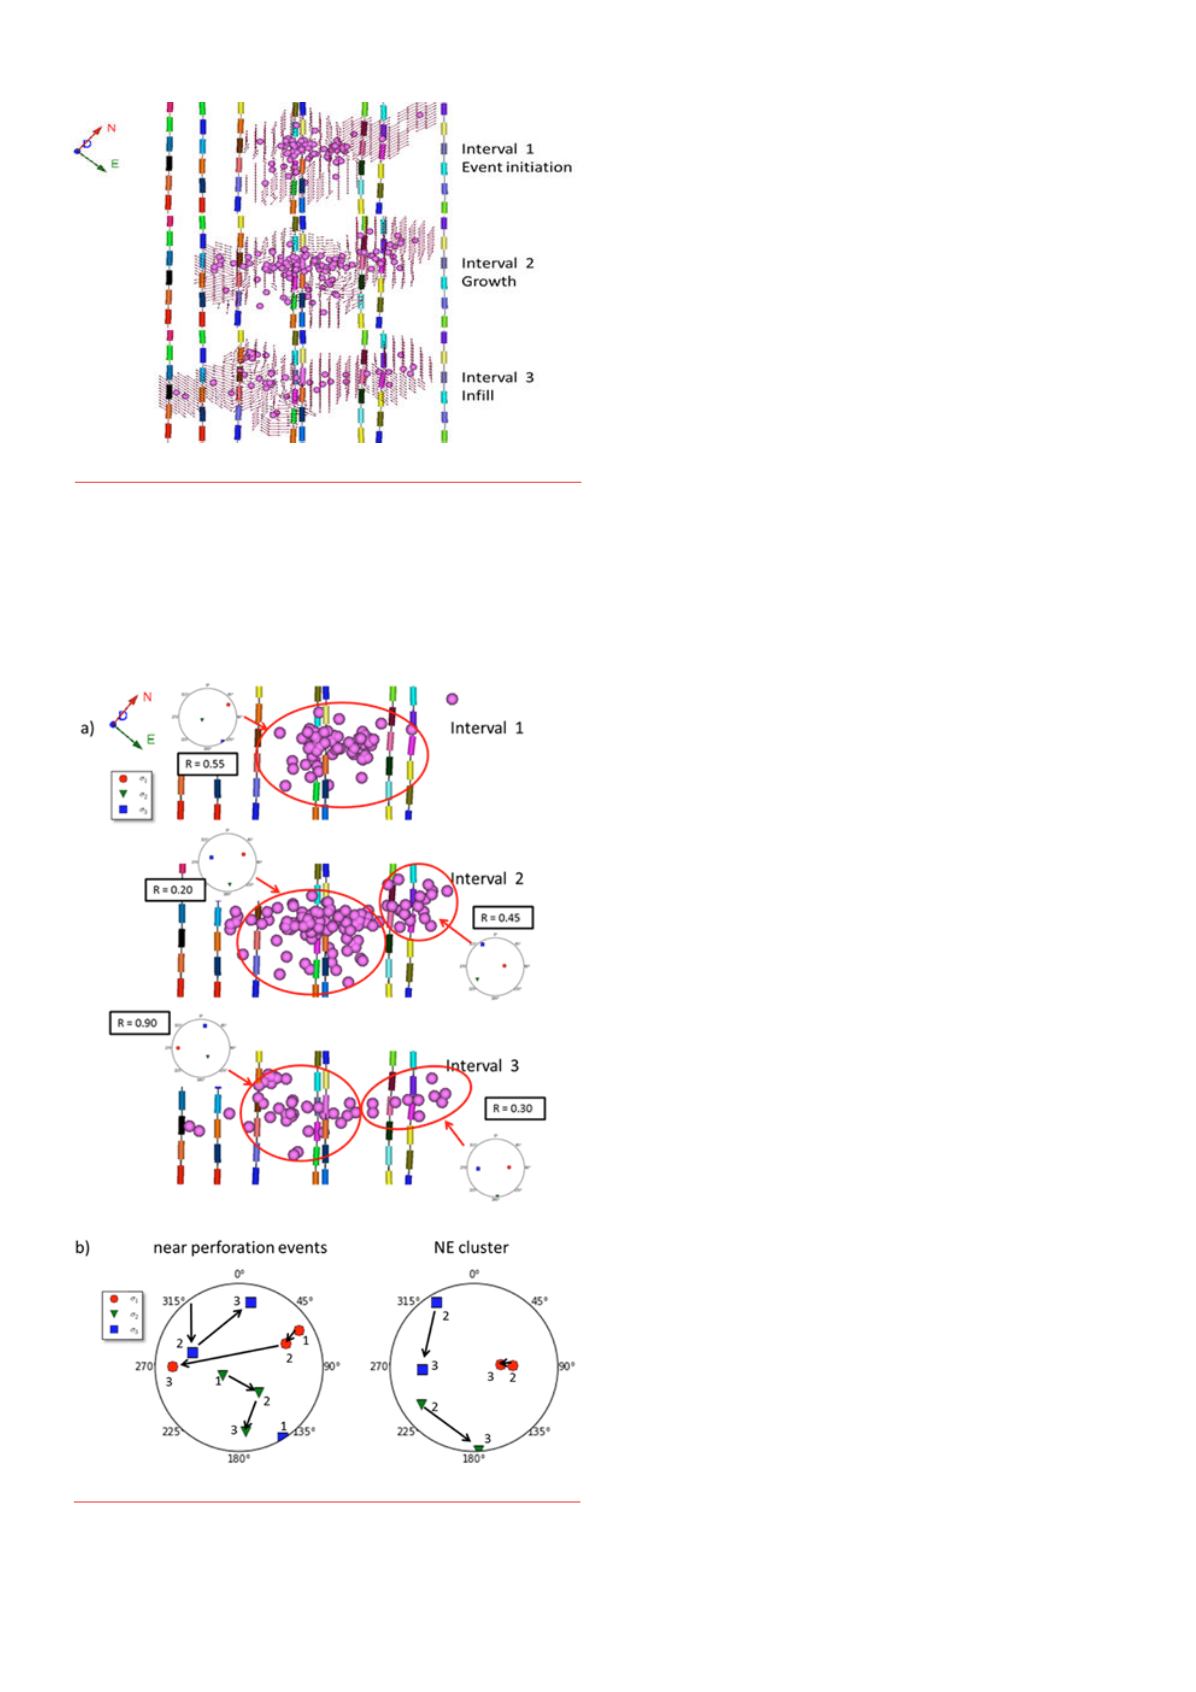
Figure 1.
Plan viewof strain conditions imaged in the reservoir through
deformation state analysis (tensional axis) ofmicroseismicmoment
tensors during three time intervals of a single stage of amulti-well
completion. Arrows depict the tensional axis of strain, such that vertical
axes of strainappear short (point out of the page), while the horizontal
tensional axes appear as long vectors.
Figure 2.
A) For the intervals discussed in Figure 1, dominant clusters
are identified to invert for the stress orientations and shape ratio in each
cluster. B) The stress paths for the clusters.


